Working with Observables
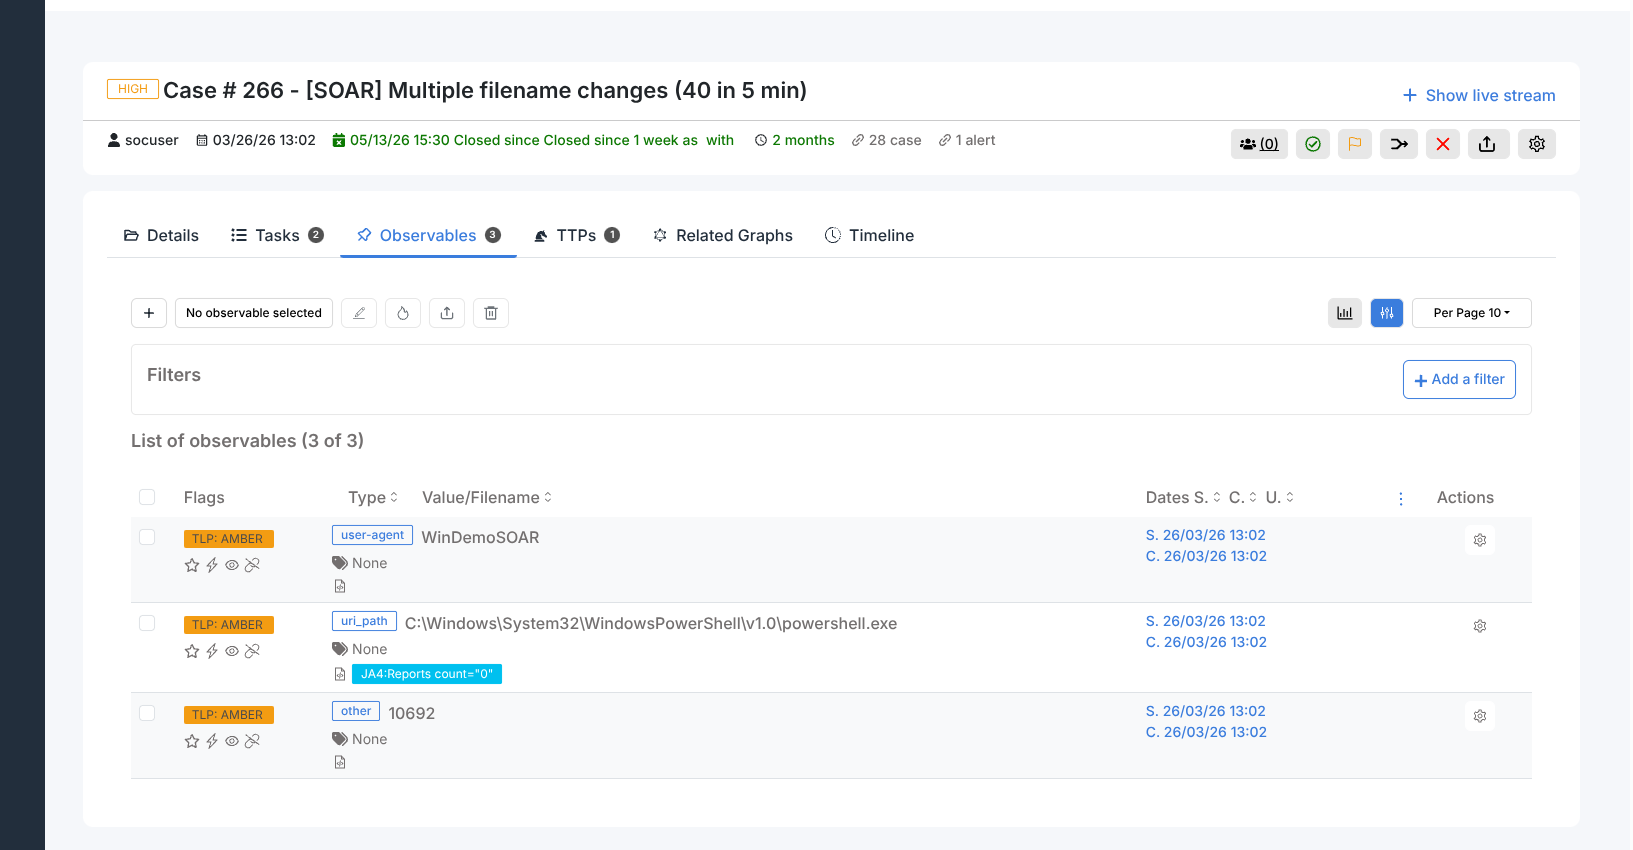
The Observables tab in a case lists all artifacts attached to that case. See the Cases overview for the list of supported types and the steps to add observables. This page covers running analyzers, reading results, exporting, and bulk editing.
Running analyzers
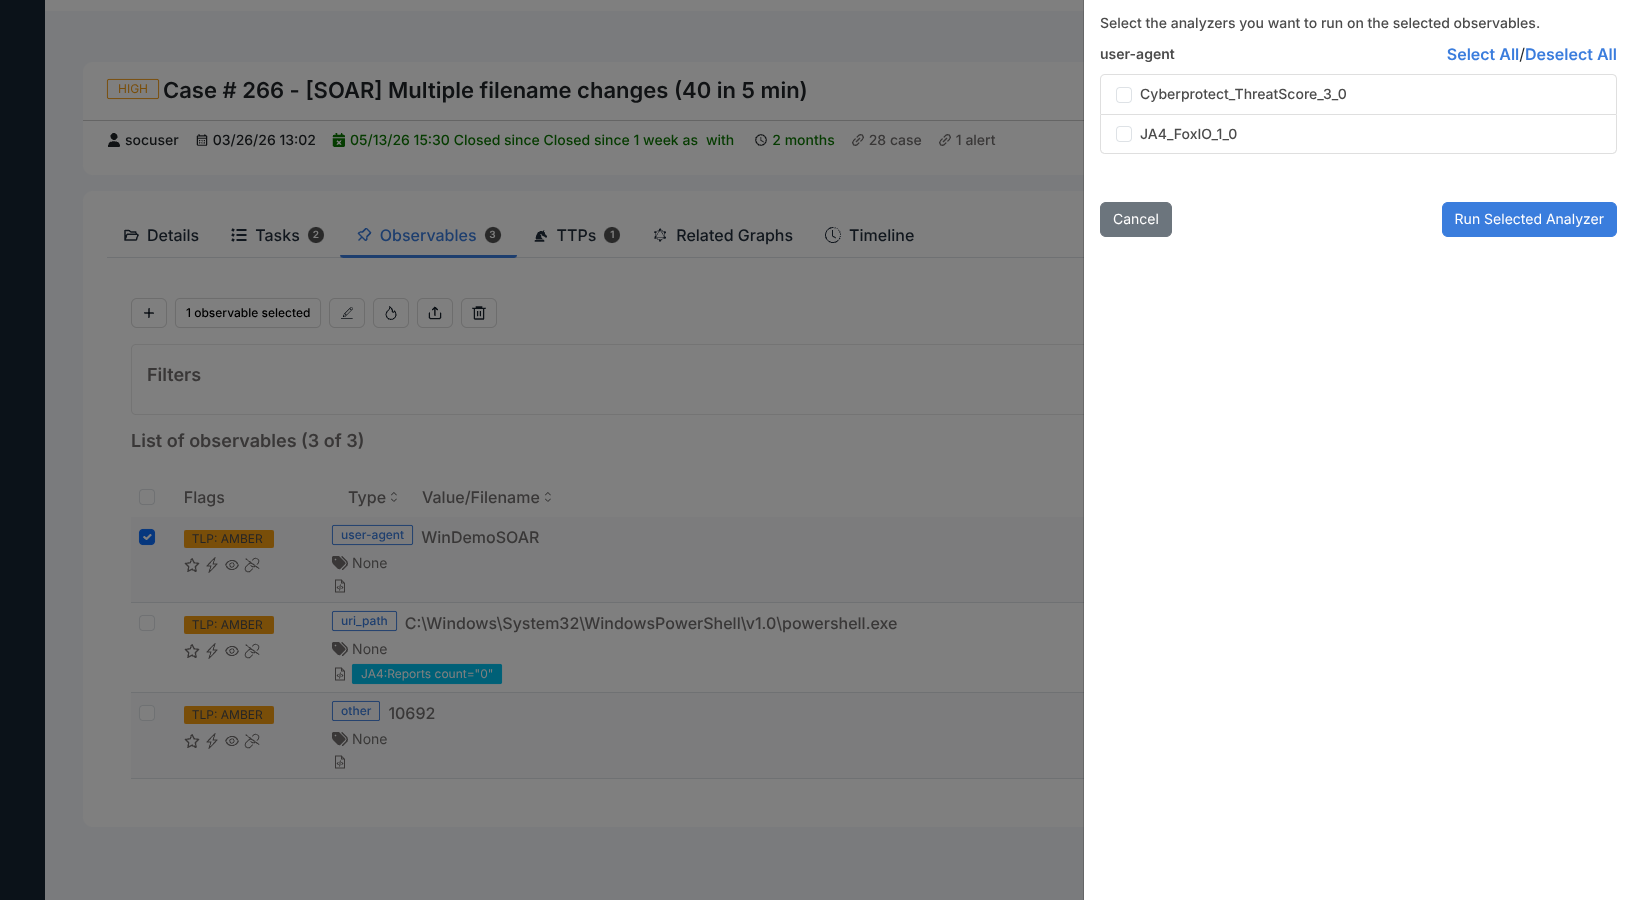
Select one or more observables using the row checkboxes, then click Run Analyzers in the toolbar. The Analyzer observable(s) dialog opens and lists every analyzer configured for the selected observable types.
Click Select All to queue all available analyzers, or tick individual ones.
Click Run Selected Analyzer to submit the jobs.
Results appear in the Observables tab as jobs complete. Expand an observable row to see the verdict (malicious / suspicious / safe / info) and a summary from each analyzer. If no analyzer is configured for a given type, the dialog shows No Analyzer Available.
Observable flags
Each observable row shows four flag icons:
Star — Is IOC. Only IOC-flagged observables are exported to MISP.
Lightning — Has been sighted in the environment.
Eye — Seen in at least one other case. Clicking the eye icon filters the list to that observable and shows the related cases.
Link — Similarity check is active.
Bulk editing
Select multiple observables and click Edit in the toolbar. The Edit Observable(s) dialog lets you change TLP, set or clear Is IOC, Has been sighted, and Ignore for similarity flags, and add or remove tags across all selected observables in one operation.
Exporting observables
Click Export in the toolbar. The Export dialog offers two output options:
Copy to clipboard — copies the observable values in the selected file format.
Save to file — downloads a file in the selected format.
Enable Protect to password-protect the exported file. A preview of the data to export is shown before you confirm.
STIX export
Select STIX as the export format to produce a Structured Threat Information Expression (STIX) bundle. The bundle encodes each observable as a STIX Indicator object and includes a dependency graph between observables that have relationships.
STIX output is compatible with threat intelligence platforms that accept STIX 2.x feeds, including MISP (via direct import) and other sharing communities.
Only observables visible in the current filter are included. Apply a filter before exporting to limit the bundle to a specific type or IOC status.
Stats
Click Stats in the toolbar to display a breakdown of the observables in the current case by type, TLP, and IOC status.
Running responders
Responders are automated response actions that operate on an observable (for example, blocking an IP on a firewall or querying a threat intelligence platform).
To run a responder on an observable:
Click the Run Responder icon on the observable row.
The Run Responder panel opens and lists all responders available for that observable type. Use the search box to filter by name or description.
Select the responder you want to run and confirm.
The responder executes asynchronously. Results and any error output appear in the Responder Jobs section of the observable detail view.
See Responders for information on installing and configuring responders.