Related Graphs
The Related Graphs tab shows a network of cases connected to the current one through shared observables. When two cases contain the same observable, an edge appears between them. The graph grows naturally as analysts investigate related incidents and add observables, making it easy to spot clusters of activity tied to a common indicator.
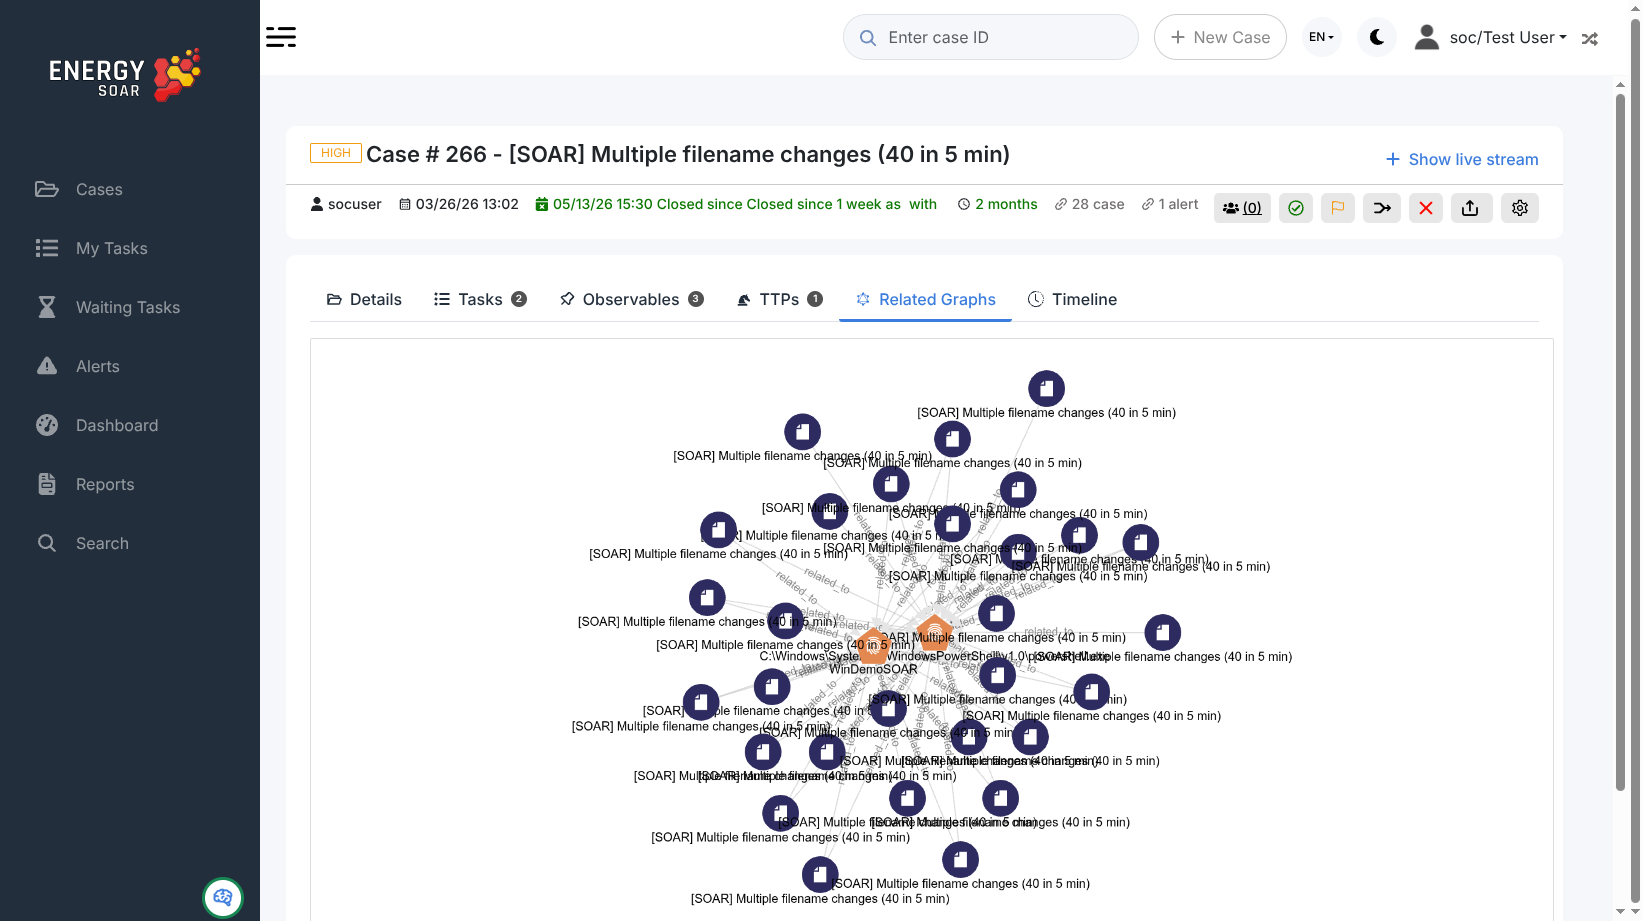
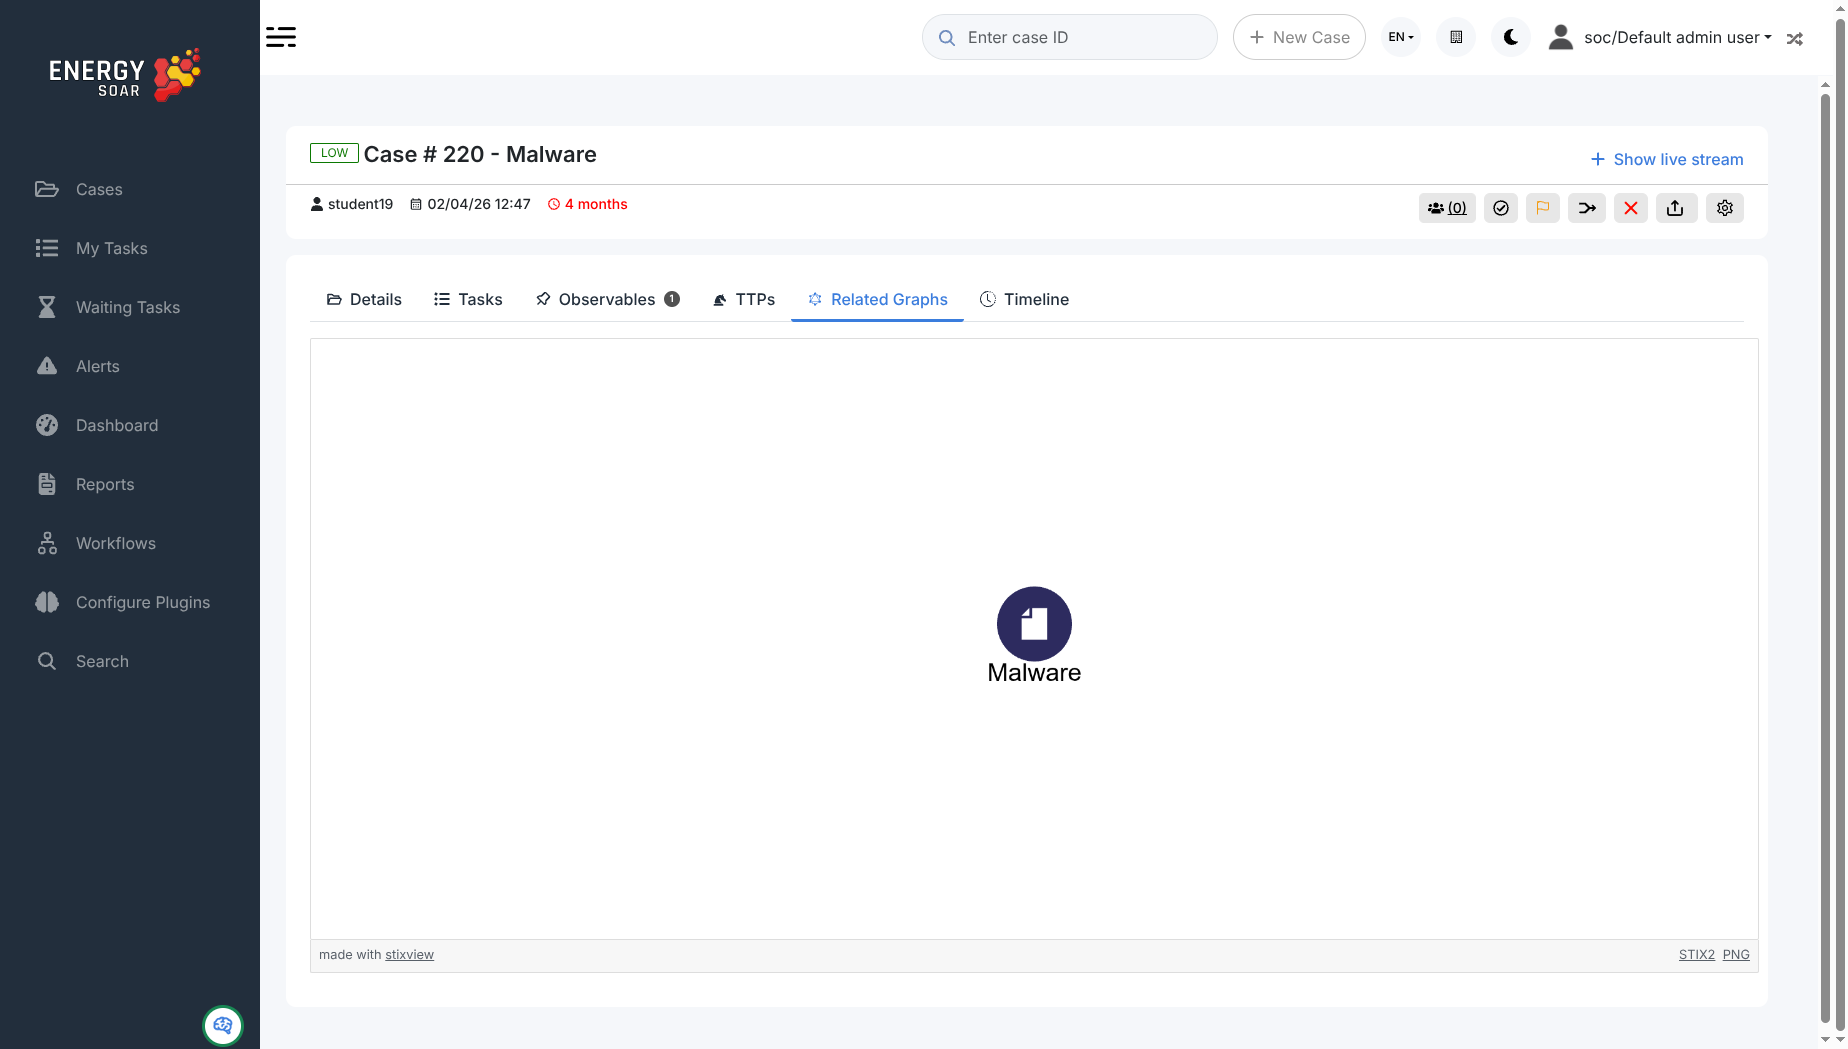
The graph is rendered with stixview, an open-source STIX2 visualiser. Each node represents a case and is labelled with its title. A case with no observables shared with any other case in the system appears as a single node.
Exporting the graph
Two export links appear in the bottom-right corner of the graph area:
STIX2 — downloads the graph as a STIX2 JSON bundle. Use this to import the graph into other threat intelligence platforms or to share it with external teams.
PNG — downloads a raster image of the current graph view, suitable for attachments in reports or tickets.