Cases
Cases list
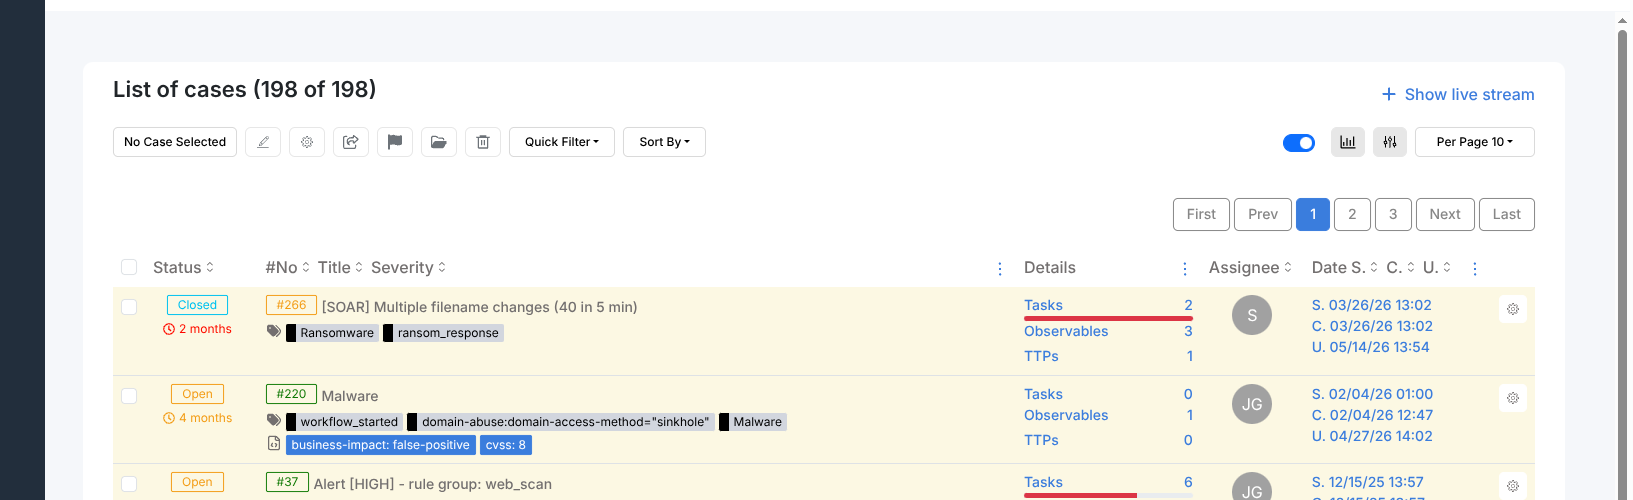
The Cases page lists all cases in the current organisation. The toolbar provides:
Show live stream — opens the live event panel (see Live stream).
Stats — shows a breakdown of open cases by severity and assignee.
Export — downloads the case list in CSV format.
Quick Filter — one-click presets to narrow the list:
Open cases — cases with status New or In Progress
Closed cases — cases with status True Positive, False Positive, or Indeterminate
My open cases — open cases assigned to the current user
My cases — all cases assigned to the current user
Owned by my org — cases owned by the current organisation
Shared with my org — cases shared from another organisation
Filters — opens the advanced filter builder. Add conditions using Add a filter: choose a field, an operator (any of, all of, none of, is empty, or date presets), and a value. Click Apply filter to apply or Clear filters to reset.
Sort By — order by newest, oldest, recently updated, or least recently updated.
Creating a case
Cases can be created in two ways:
From an alert — select the alert, click Yes, Import in the Alert Preview panel. See Creating a Case from an Alert for the full procedure.
Manually — click + New Case in the Cases list toolbar.
The Create New Case panel opens. Click Empty case to start with a blank form, or select a template from the list to pre-populate tasks, tags, and custom fields.
The form opens with the following default values:
Date — today’s date.
Severity — Low.
TLP — White.
PAP — White.
Fill in the Title (required) and Description. Click Create case.
Bulk case actions
Tick the checkbox at the left of one or more case rows to select them. A count of selected cases appears in the action bar, which unlocks the following bulk operations:
Edit — opens the Update case(s) panel. Change TLP, PAP, severity, assignee, or add/remove tags across all selected cases in one operation.
Run Responder — runs an Automation responder against all selected cases.
Share — shares selected cases with another linked organisation.
Add Flag — marks selected cases with a flag for quick identification.
Delete — permanently removes the selected cases. Requires the
manageCasepermission.
Selecting a case with the checkbox does not navigate away from the list. To deselect all, tick the header checkbox.
Case preview
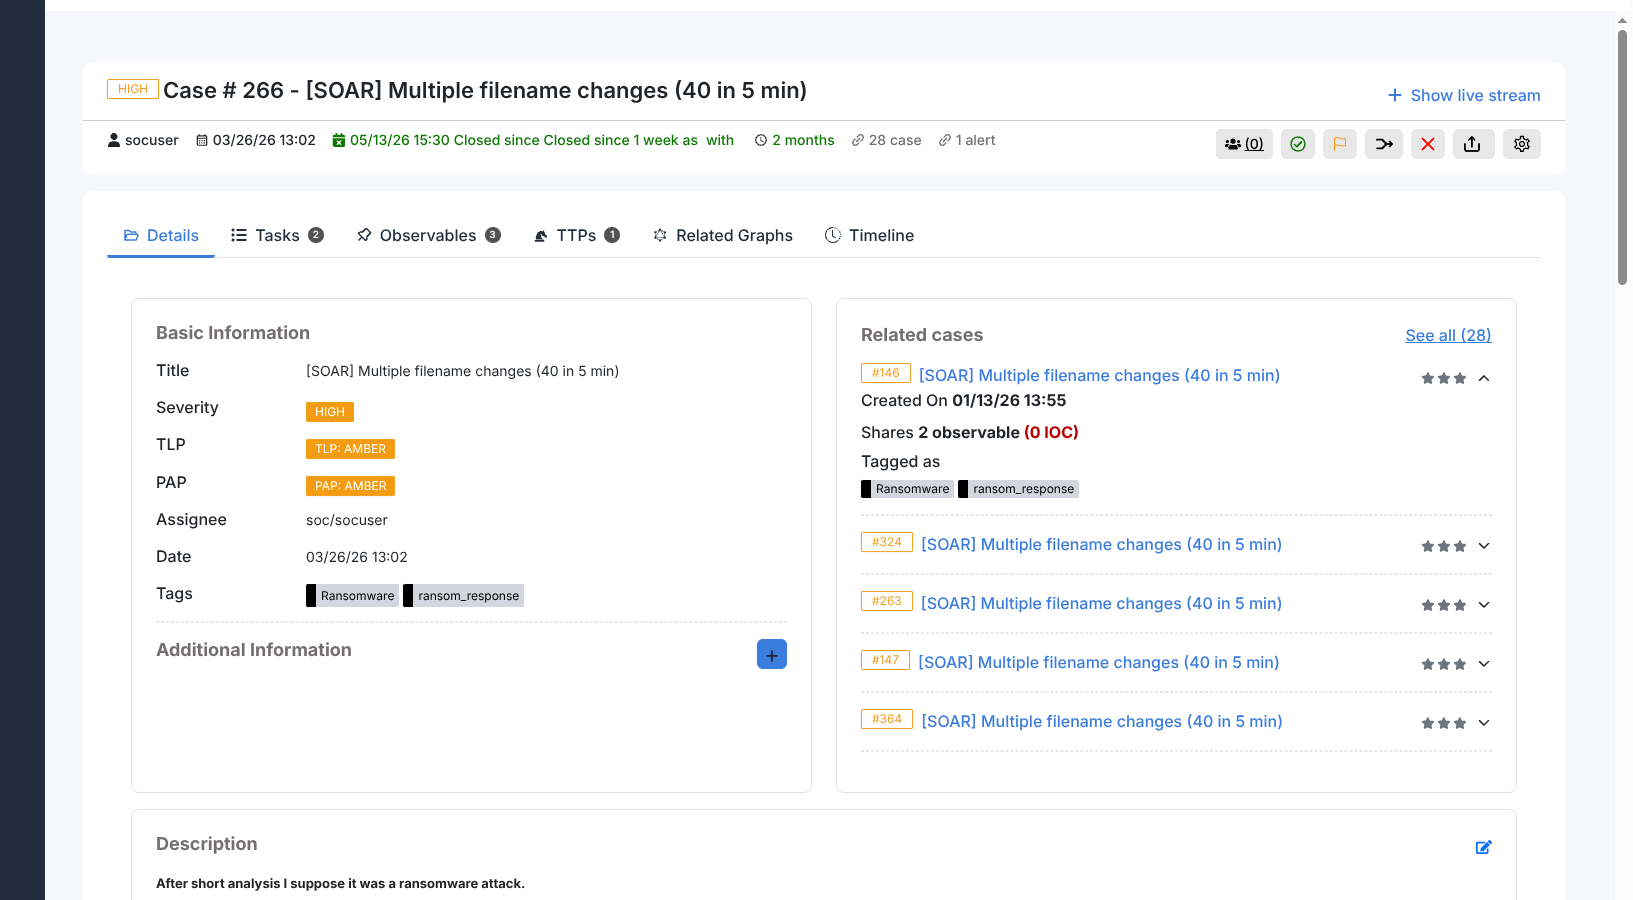
Clicking a case in the Cases list opens the Case Preview panel. It is organised into six tabs.
Details tab
Shows the core case fields: title, severity, TLP, PAP, assignee, date, tags, description, and any related cases linked to this one.
Tasks tab
Lists all tasks associated with the case in a flat table with columns: status, group, task title, date, and assignee. Task statuses are Waiting, In Progress, and Completed.
Observables tab
Lists all artifacts added to the case. For each observable the tab shows analysis results from executed analyzers, tags, TLP classification, and related information from external sources.
TTPs tab
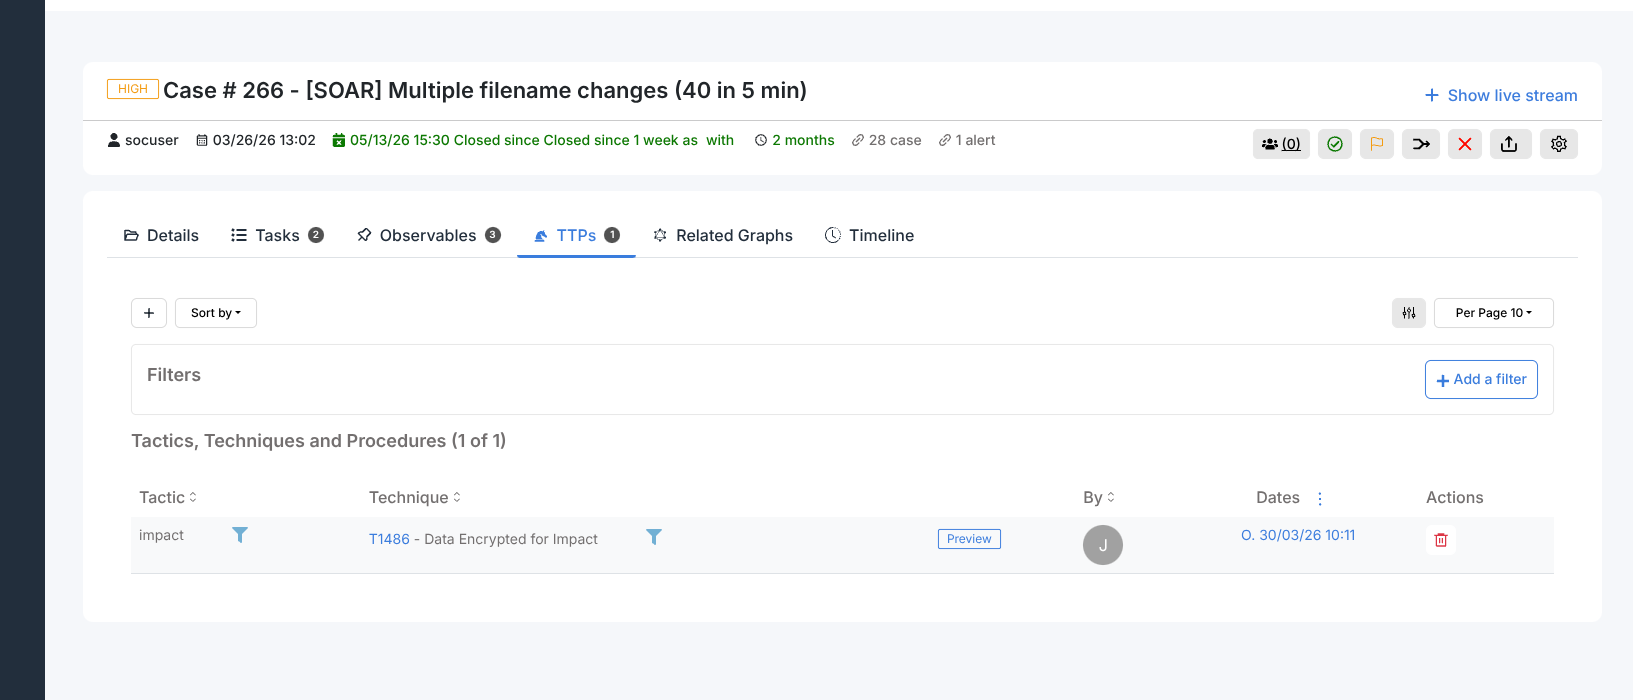
The TTPs tab maps the incident to the MITRE ATT&CK framework. Each entry records a tactic, a technique within that tactic, and an optional procedure description.
The tab shows a table with columns: Tactic, Technique, Occur Date, Dates (created / updated), and Actions. Use Sort by to order entries by newest, oldest, recently updated, or least recently updated. The Filters button opens the filter panel for narrowing results by tactic, technique, or date range.
Adding a TTP
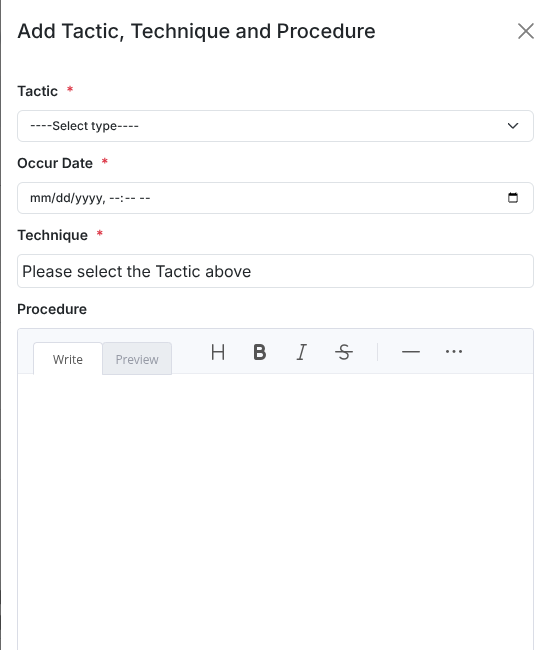
Click + to open the Add Tactic, Technique and Procedure panel.
Select a Tactic from the dropdown.
Set the Occur Date (required) — when the technique was observed.
Select a Technique. The dropdown is disabled until a tactic is chosen; once a tactic is selected it shows the matching techniques.
Enter a Procedure description (optional) using the rich text editor. The editor supports markdown with a Write/Preview toggle.
TTP detail view
Click Preview on any row to open the TTP detail panel. It shows the internal ID, Created By user, creation date, Tactic, Technique, Technique name, Occur Date, and Procedure. When the imported ATT&CK pattern contains additional MITRE metadata (Data Sources, Platforms, Defense Bypassed, Permissions Required, etc.) it appears below the procedure.
To delete a TTP, use the red bin icon in the row’s Actions column.
Timeline tab
Shows a reverse-chronological audit log of all events that occurred within the case. Each entry records the timestamp, the event type, the user who performed the action, and event-specific details.
Five event categories appear in the timeline:
Case — case field changes (created, updated)
Task — task created or updated
Observable — observable added or updated
procedure — ATT&CK procedure added or updated
action — responder action created or updated, including outcome status
The toolbar provides:
Search — filter entries by keyword
Event type filter — show only one category of events
Export PDF — download the full timeline as a PDF report
The right-hand panel shows incident metadata (severity, status, owner, tags), observable and task counts, and the number of events per category.
Observables
Observables are artifacts attached to a case. The following types are supported:
autonomous-system |
fqdn |
registry |
|
domain |
hash |
mail-subject |
uri_path |
file |
hostname |
other |
url |
filename |
ip |
regexp |
user-agent |
Observable types can be extended in Admin > Observable types.
Adding observables
Open the case and click Add Observable.
Select the observable type (e.g. ip, domain, url, mail). For
filetype, upload a file directly. Zipped archives are supported. Hashes are calculated automatically after upload.Enter one observable per line to bulk-add multiple at once.
Set the TLP flag.
Optionally:
Is IOC — marks the observable as a confirmed indicator of compromise. Only IOC-flagged observables are exported to MISP.
Has been sighted — marks observables that have been observed in the environment.
Ignore for similarity — disables the “seen in other cases” cross-check for this observable.
Add tags or a description, then click Create Observable(s).
Each observable row shows four flag icons: star (IOC), lightning (sighted in the environment), eye (seen in other cases), and link (similarity check active). The eye icon is visible when the observable appears in at least one other case; clicking it filters the list to that observable.
Downloaded file observables are delivered as password-protected ZIP archives.
Case templates
Case templates pre-populate new cases with a fixed set of tasks, tags, custom fields,
description, severity, and TLP/PAP settings. Users with the manageCaseTemplate
permission can manage templates from Organisation > Case Templates.
Creating a template
Click + to open the Add case template panel and fill in:
Template name (required, must be unique)
Display name
Description (required)
Title prefix
Severity
TLP/PAP
Tags
Tasks
Custom fields
Importing and exporting
Templates can be imported and exported as JSON files using the Import template and Export buttons in the template list.
Default templates
Energy SOAR ships with the following built-in case templates:
Admin creation
AUTOCASE
Data Theft
Denial of Service (DoS)
Malware
Mass deleting files or folders
Privileged access
Short-lived account
Suspicious e-mail
Suspicious User Activity
Suspicious VPN connection
Unauthorized Access
User authentication from multiple devices