Dashboard
The Dashboard section lets analysts create and view chart-based summaries of case and task data. Each dashboard contains one or more widgets arranged in a grid.
Dashboard list
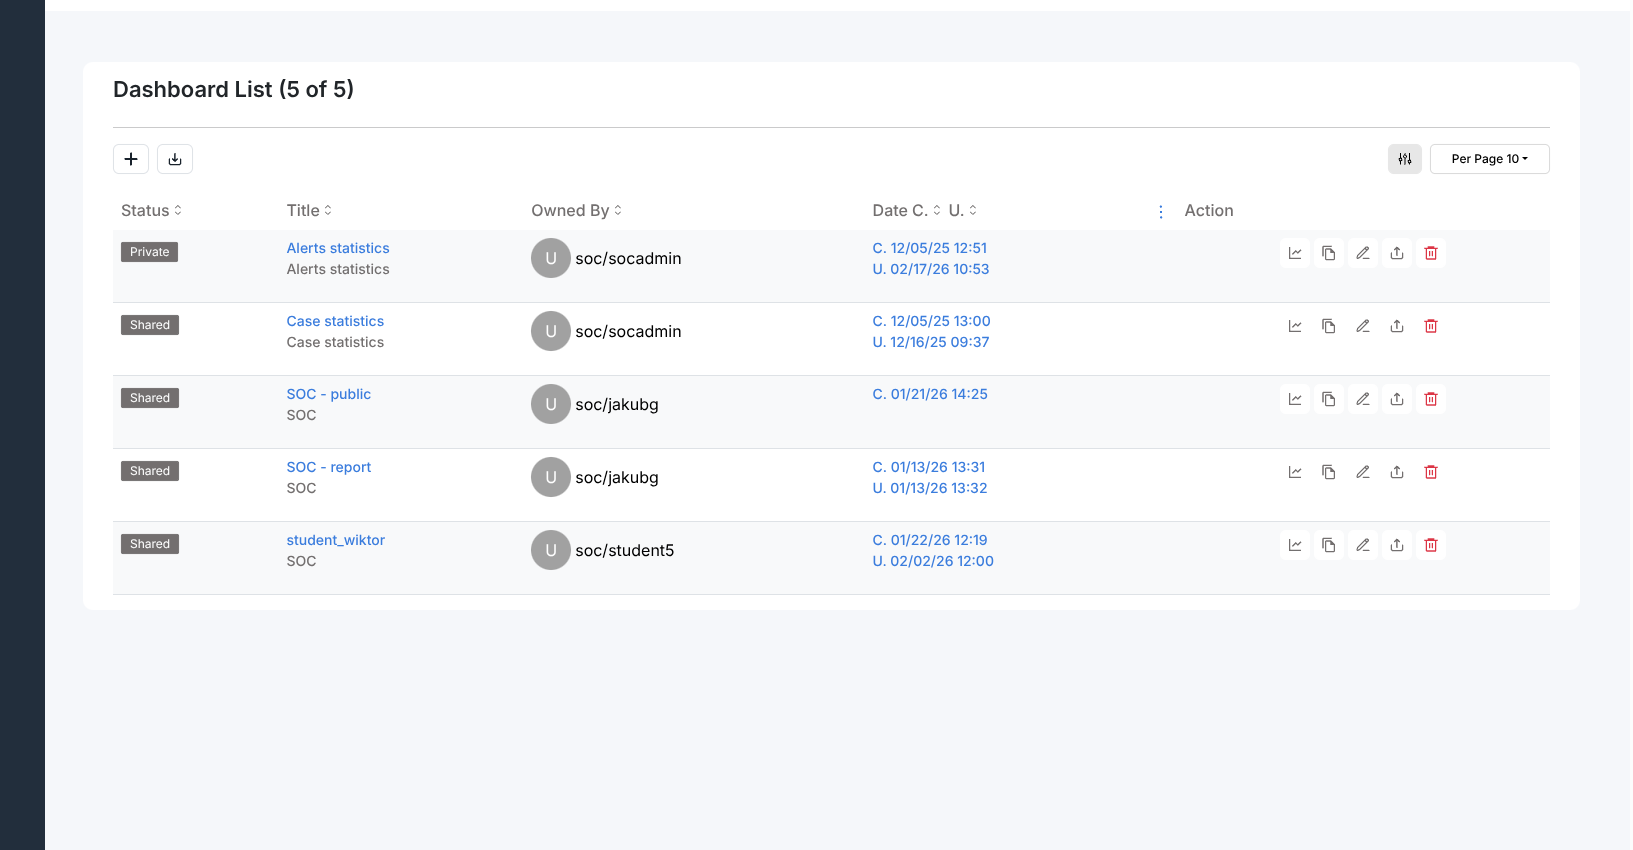
The dashboard list shows all dashboards available to the current organisation. Each row displays:
Status —
Private(visible only to the owner) orShared(visible to all organisation members)Title — dashboard name and description
Owned By — the user who created the dashboard
Date — two timestamps: C (created), U (last updated)
List controls
The toolbar above the list provides:
+ — opens the creation panel for a new dashboard
Import — imports a dashboard definition from a JSON file
Row actions
Each row provides five icon buttons:
View — opens the dashboard
Copy — duplicates the dashboard
Edit — opens the edit panel to rename or update the description
Export — downloads the dashboard definition as a JSON file
Delete — permanently removes the dashboard
Creating a dashboard
Clicking + opens a slide-in panel with three required fields:
Title
Description
Visibility —
PrivateorShared
Click Save to create the empty dashboard, then open it to add widgets.
Dashboard view
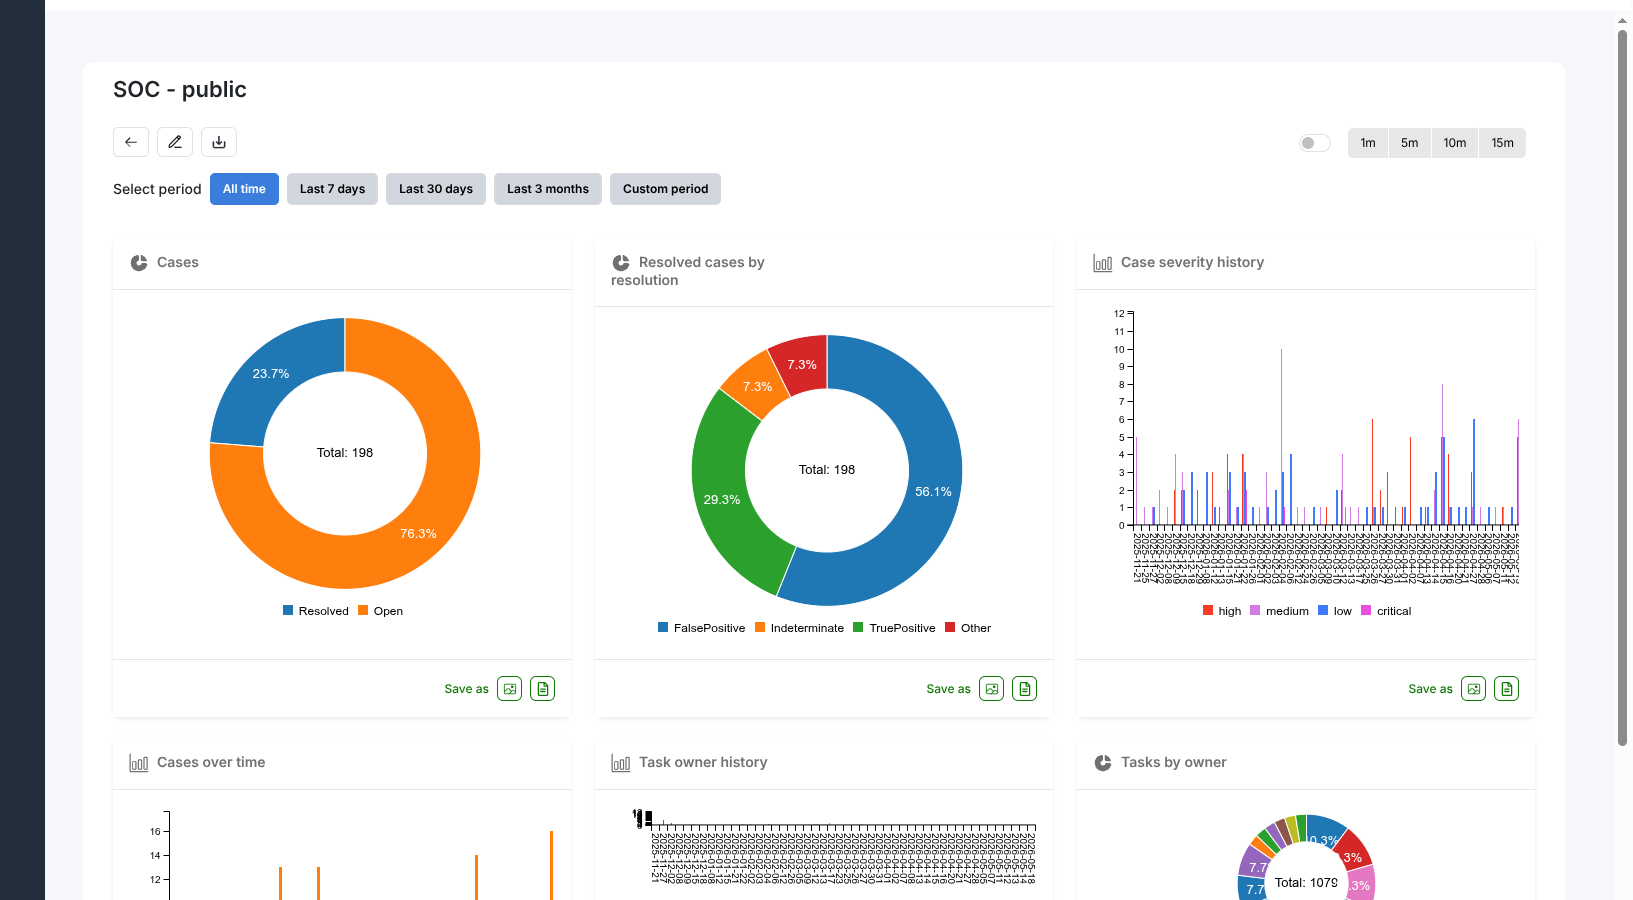
Opening a dashboard shows all its widgets. The toolbar provides:
Back — returns to the dashboard list
Edit — enters layout edit mode, where widgets can be added, moved, and removed; the button is hidden while edit mode is active
Export — downloads the dashboard definition as a JSON file
Auto-refresh
A toggle enables automatic data reload. The interval buttons (1m, 5m, 10m, 15m) control how often the dashboard refreshes.
Period selector
The Select period control filters all widgets to a chosen time range:
All time
Last 7 days
Last 30 days
Last 3 months
Custom period (date range picker)
Widgets
The following widget types are available in the editor:
Bar — time-series bar chart, grouped by a date field and interval
Line — time-series line chart
Multi Lines — multiple line series on a single chart
Donut — distribution chart showing proportional breakdown of a field
Counter — numeric summary of aggregated values
Text — free-text widget
Widgets that query data can target either cases (case) or case tasks
(case_task).
Each widget footer provides a Save as button with two export options:
Image icon — saves the chart as a PNG file
File icon — saves the chart data as a CSV file