Alerts
Alerts are events generated by connected sources (such as a SIEM) and delivered to Energy SOAR for triage. The Alerts page lists all incoming alerts and lets analysts review, ignore, or promote them to cases.
Alert list
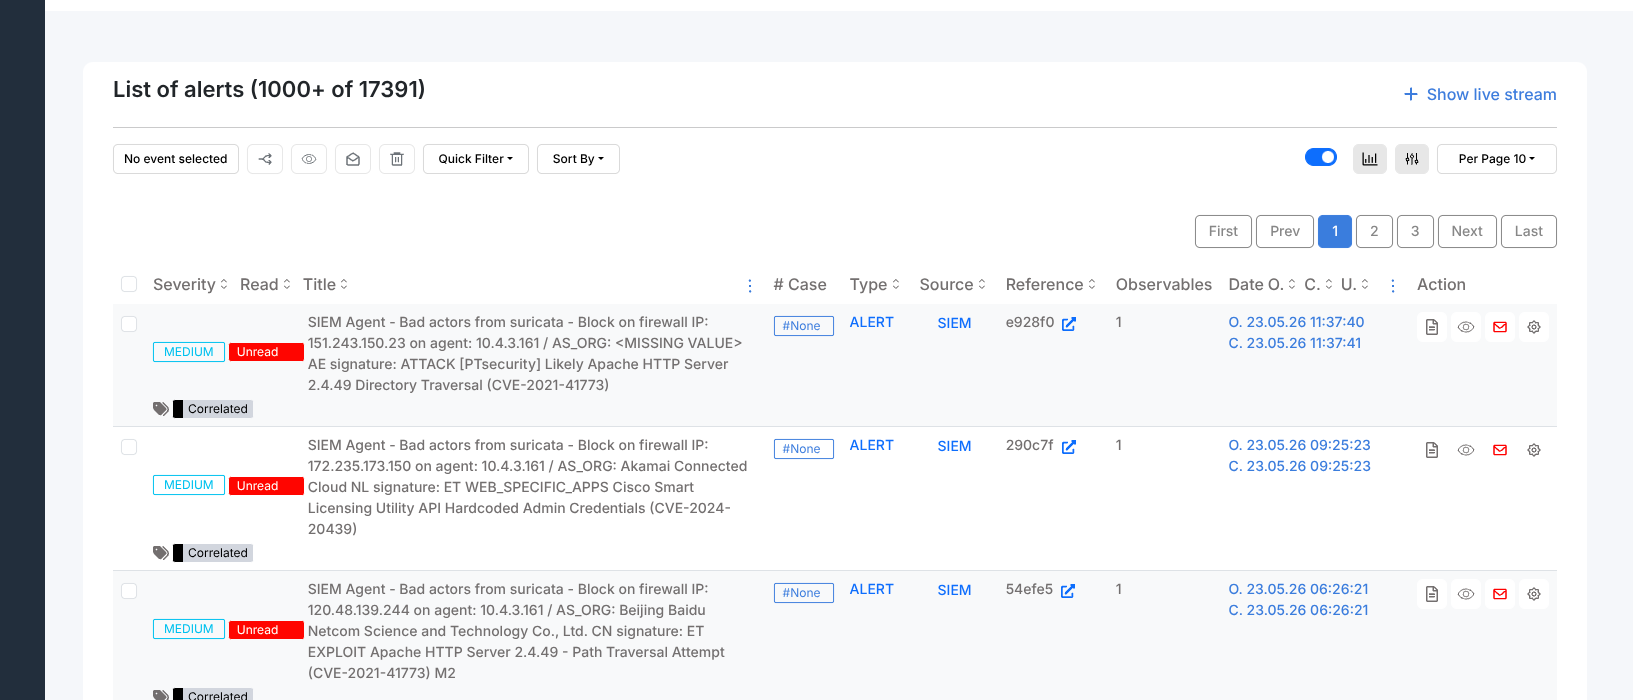
The alert list shows the following columns:
Severity — LOW, MEDIUM, HIGH, or CRITICAL
Read — whether the alert has been opened (Unread or Read)
Title — alert name plus any tags assigned by the source
# Case — the case number if the alert has been promoted, otherwise
#NoneType — alert category as sent by the source
Source — the system that generated the alert (e.g. SIEM)
Reference — the source system’s internal identifier
Observables — number of observables attached to the alert
Date — three timestamps: O (observed), C (created in Energy SOAR), U (last updated)
Use Quick Filter, Sort By, and Per Page to narrow and sort the list.
Quick Filter provides one-click presets:
Unread events — alerts not yet opened
Read events — alerts that have been viewed
Imported events — alerts promoted to a case
Followed events — alerts with “Ignore new updates” turned off (actively tracked)
Ignored events — alerts dismissed with the Ignore action
For advanced filtering, click the Filters (slider) icon to open the filter builder. Add one or more filter conditions using the Add a filter control. Each condition has a field selector, an operator (any of, all of, none of, is empty, or for date fields: today, last 7 days, last 30 days, last 3 months, last 6 months, last year, Custom), and a value. Click Apply filter to apply, Clear filters to reset.
Alert statuses
Each alert carries one of four statuses:
New — arrived and not yet reviewed
Updated — the source has sent updated fields since the last view
Imported — promoted to a case; the case number appears in the # Case column
Ignored — dismissed without creating a case
Row actions
Each row has four icon buttons on the right:
Preview — opens the Alert Preview panel
Mark as read — marks the alert as Read without opening the preview
Ignore — sets the alert status to Ignored
Run Responder — opens the responder selector to run an automated response
Alert Preview
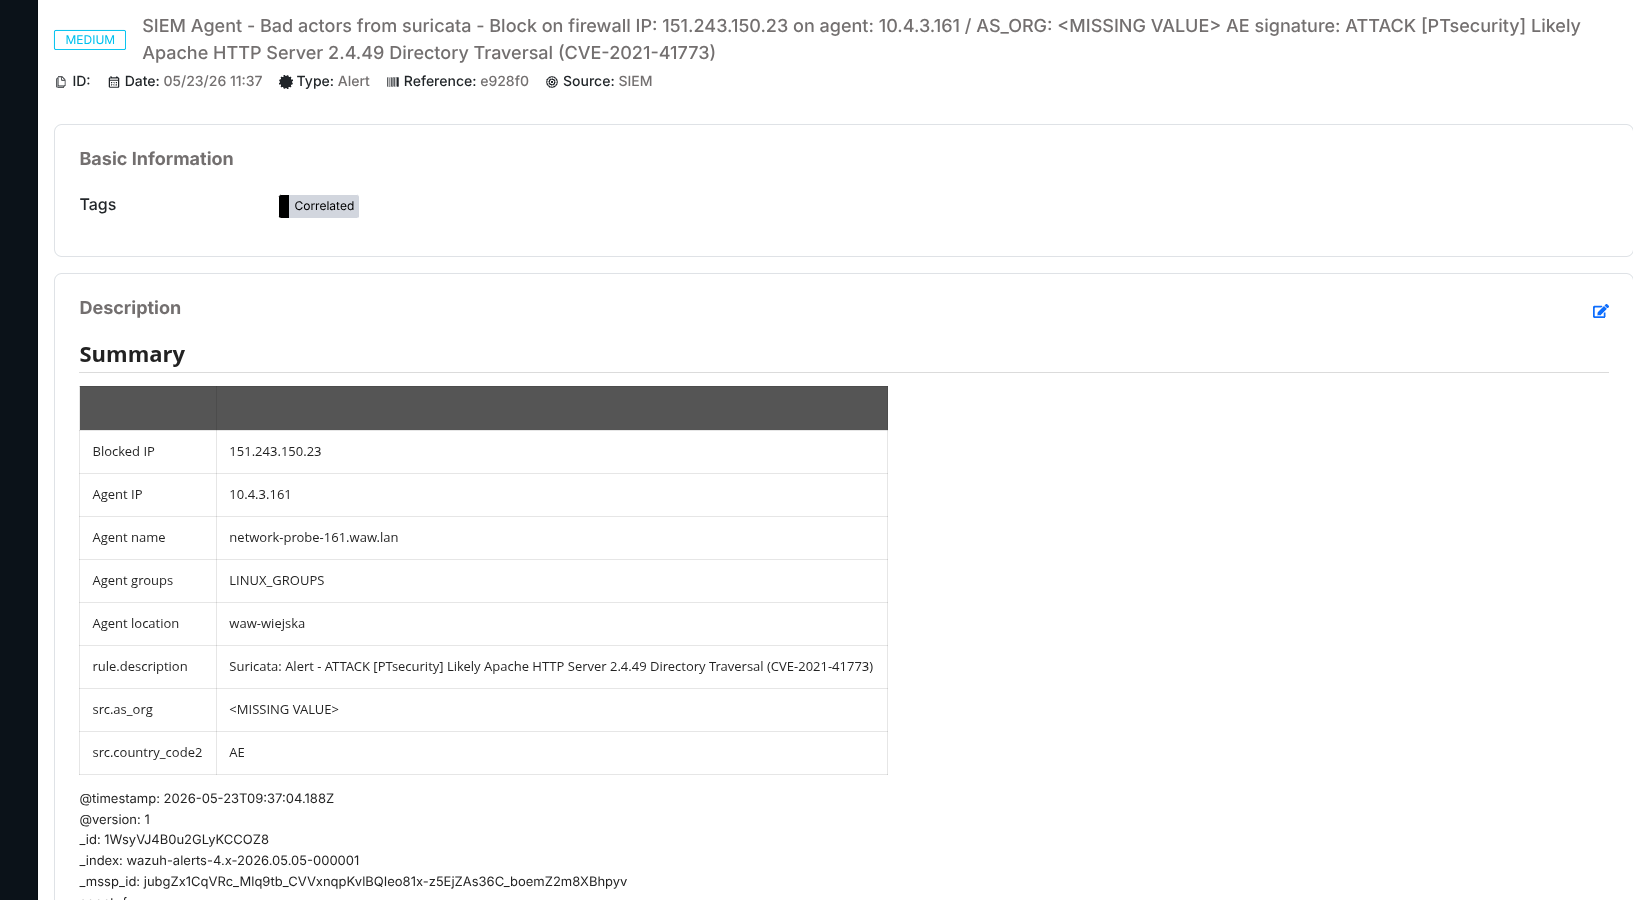
Clicking Preview on a row opens the Alert Preview panel. It contains:
- Basic Information
Tags assigned to the alert by the source.
- Description
A summary table with fields extracted from the source event (host, IP address, message, timestamp, and other source-specific fields), followed by the raw event data.
- Additional fields
Custom fields attached to the alert, if any.
- Observables tab
Lists all observables attached to the alert. Each observable shows its TLP classification, type (e.g.
ip,domain), value, and timestamps.- Similar cases tab
Lists cases from the same organisation that share at least one observable with this alert. Use this to check whether the event matches a known incident before creating a new case.
Promoting an alert to a case
From the Alert Preview panel, select a case template in the Import alert as dropdown at the bottom of the panel and click Yes, Import.
Selecting --Empty case-- creates a new blank case. Selecting a template
pre-populates the case with that template’s tasks, tags, and fields.
After import the alert status changes to Imported and the linked case number appears in the # Case column of the alert list.
Additional actions in the preview
The bottom action bar in the Alert Preview also provides:
Mark as read / Mark as unread — toggles the read status of the alert.
Ignore new updates — stops the platform from marking this alert as Updated when the source sends new data.
Merge selection into case — adds the alert to an existing case.
Delete — permanently deletes the alert.