First Investigation
This walkthrough covers a complete investigation cycle: find an incoming alert, triage it, promote it to a case, add an observable, run an analyzer, and close the case.
Triage an alert
Click Alerts in the sidebar. The page lists all incoming alerts with columns: Severity, Read, Title, # Case, Type, Source, Reference, Observables, and Date. Use Quick Filter, Sort By, and Per Page to narrow the view.
Each row has four action buttons on the right: Preview, Mark as read, Ignore, and Run Responder.
Click Preview on any row to open the Alert Preview panel. The panel has five sections:
Basic Information — tags assigned by the source.
Description — extracted fields (host, IP address, message, timestamp) and the raw event data.
Additional fields — custom fields attached to the alert, if any.
Observables tab — artifacts already attached to the alert.
Similar cases tab — cases in your organisation that share at least one observable with this alert.
Before creating a new case, check the Similar cases tab. If a matching case already exists, you can merge the alert into it rather than opening a duplicate.
Promote the alert to a case
At the bottom of the Alert Preview panel, find the Import alert as dropdown. Select a case template, then click Yes, Import.
Choosing
--Empty case--creates a blank case.Choosing a named template pre-populates the case with that template’s tasks, tags, and custom fields.
After import, the alert status changes to Imported and the linked case number appears in the # Case column.
Open the case
Click Cases in the sidebar. Find the newly created case in the list and click it to open the case. The header shows the case number and title. The case has six tabs: Details, Tasks, Observables, TTPs, Related Graphs, and Timeline.
The Tasks tab lists any tasks from the template. Each task carries one of three statuses: Waiting, In Progress, or Completed. Work through the tasks as you investigate.
Add an observable
Open the Observables tab, then click Add Observable. The Create new observable(s) dialog opens.
Select the observable Type — for example,
ip,domain,url, ormail.In the Value field, enter the value. Type one observable per line to bulk-add multiple at once.
Set the TLP level: WHITE, GREEN, AMBER, or RED.
Optionally set one or more flags:
Is IOC — marks the observable as a confirmed indicator of compromise. Only IOC-flagged observables are exported to MISP.
Has been sighted — marks observables that you have observed in the environment.
Ignore for similarity — disables cross-case matching for this observable.
Add Tags or a Description, then click Create Observable(s).
Run an analyzer
In the Observables tab, tick one or more observables using the checkboxes, then click Run Analyzers.
The Analyzer observable(s) dialog lists the analyzers available for the selected observable types. Choose individual analyzers or click Select All, then click Run Selected Analyzer.
Results appear in the Observables tab once processing completes. Each observable row shows the verdict from every analyzer that ran.
Close the case
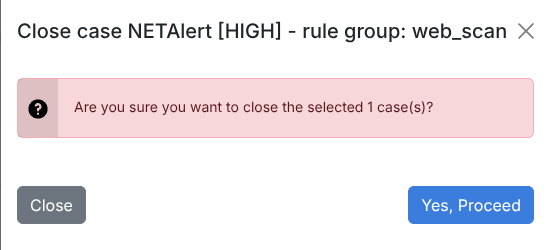
When the investigation is complete, click Close case in the case toolbar.
A panel slides in asking: “Are you sure you want to close the selected 1 case(s)?” Click Yes, Proceed.
If the case has open or unassigned tasks, a second panel lists them and warns that unassigned tasks will be permanently removed. Click Close tasks & case to continue.
The final panel asks you to record the outcome.
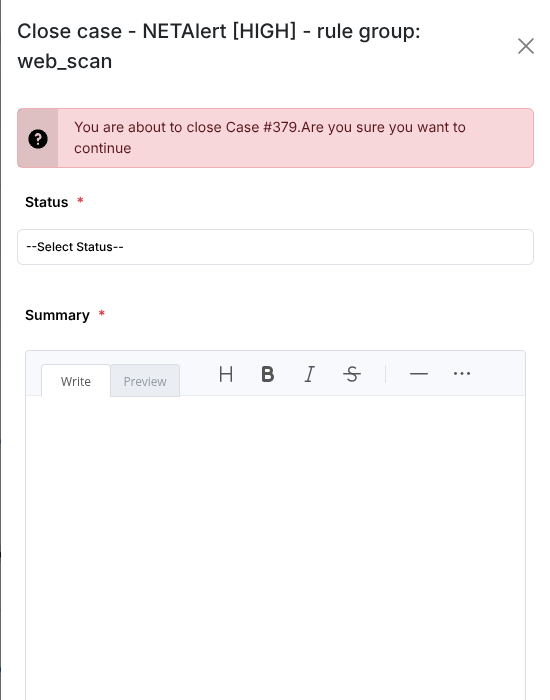
Select the Status:
True Positive — investigation clearly demonstrates malicious activity (scam, phishing, malspam, malware, cybersquatting).
False Positive — investigation shows nothing malicious.
Indeterminate — insufficient evidence to determine whether the activity was malicious.
Other — does not require an investigation.
If you selected True Positive, also set the Impact:
Yes — availability, integrity, or confidentiality was altered.
No — security measures blocked the attack or infection.
Enter a closing note in the Summary field, then click Close case.
What to explore next
You have completed the core workflow: alert → case → investigation → closure. The platform has more to offer:
Tasks — how to manage tasks, task logs, and the Waiting Tasks queue.
Working with Observables — running analyzers in depth, bulk editing, and exporting to STIX or MISP.
Dashboard — building dashboards and scheduling PDF reports.
Workflows — automating response with the playbook engine.
Suspicious E-mail Investigation — a complete phishing scenario with the automated Phishing workflow.